The Power of Visual Content in Association Communications

Visual content reaches an individual’s brain in a quicker and more comprehensible way than text-only information. Your brain is hard-wired to identify and process visual information more efficiently than text-based information. This is useful considering that 90 percent of information transmitted to the brain is visual, as found from research by Market Domination Media. So, is your association using images in a way that captures your target audience’s attention?
Even if your association has an experienced writer on staff, text alone can fall short when it comes to engaging your readers and sharing your message. Including an image that helps explain what your article or announcement is about can help hold your audience’s interest while giving your association the opportunity to stand out from all the communications your members receive on a daily basis.
![]()
Visual content reaches an individual’s brain in a quicker and more comprehensible way than text-only information.
Using images in your association’s communications opens the door to the rest of the information you present.
Did you know that 65 percent of individuals prefer emails that contain mostly images versus 35 percent who prefer mostly text?
Our research shows that adding images to your tweets will substantially increase engagement.
Research shows that visual content increases audience engagement
According to HubSpot data, leveraging visual content boosts social media, email and blog traffic. Here are a few important stats to take into consideration when putting together your association’s marketing strategy for 2016:
- Tweets with images receive 18 percent more clicks, 89 percent more favorites, and 150 percent more retweets than text-only tweets.
- Facebook posts with photos saw the most engagement – accounting for 87 percent of total interactions, according to Social Bakers, which looks at the top 10 percent of posts made by more than 30,000 brand pages.
- Last year, the amount of video from people and brands in Facebook’s news feed increased 3.6 times year-over-year.
- Sixty-five percent of individuals prefer emails that contain mostly images versus 35 percent who prefer mostly text.
As you can see from this data, images in social media posts and email work well because they open the door to the rest of the information you present.
Plus, images can be easy for your association to find and create. So, why wouldn’t you use them when the opportunity strikes? For example, if your association has an annual conference coming up and you need to send reminder emails, why not include images from last year’s conference to show those members who are on the fence about attending this year what they can expect from your event?
Or, on your association’s Twitter feed, you can post a #ThrowbackThursday (#TBT) image from last year’s conference with a link to register for the current year’s event. With these types of images, you’re letting members into your world by sharing close-ups from your association’s environment.
Examples of how images impact audience engagement
What better way to confirm how images effectively increase communication engagement than by testing them ourselves via email and social media?
Here at Association Adviser, we sent out two versions of our monthly newsletter to see if the inclusion of images in the text-based content would have any impact on reader engagement. Each version had identical content, but one version included images and the other did not. We ran an A/B test in which each email was first sent to a small number of subscribers. Then, our mailing system measured which version earned more engagement in terms of opens and clicks. The email that included images received 33 percent more clicks to articles on our website.
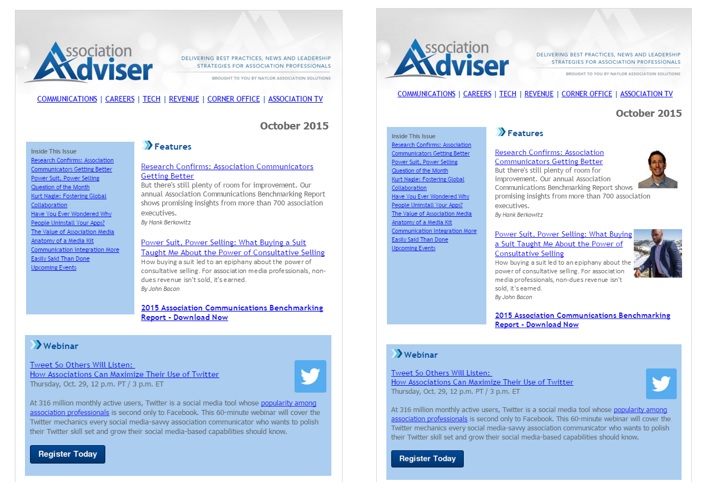
Through this test, we confirmed that images do encourage readers to click through and learn more. We also saw that readers of the newsletter that contained images were more likely to forward our newsletter to a colleague or to share one of the articles on their social media accounts.
In another example, we put together a Facebook and Twitter marketing plan to promote the United Motorcoach Association’s annual expo. We tested which types of images produced more ad engagement through the use of the same ad text but two types of images: an image of event attendees versus an expo-themed image with the event date.
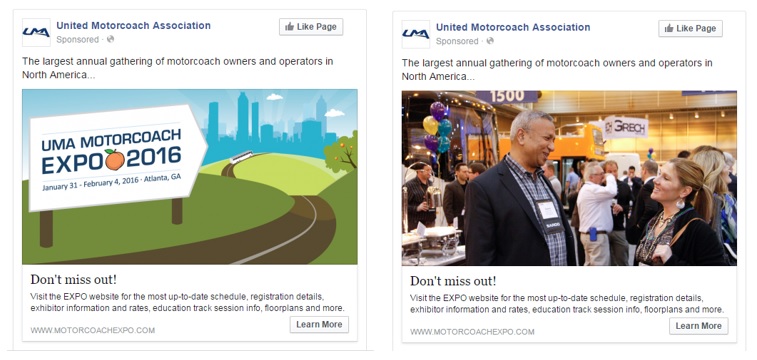
Which Facebook ad do you think caught more attention from potential attendees?
That’s right! We found that the post containing photos of real people outperformed the expo-themed graphic in terms of click throughs to UMA’s expo website. For the exhibitors we targeted on Twitter, the images of people relate to what they are looking for, which is meeting with decision-makers face-to-face. We also discovered that the expo-themed image performed better on Twitter than the images of people. This could be because our target audience for these ads – attendees – are more in tune with the event and destination as a whole. Attendees are looking for more than just one-on-one time with certain individuals, and more about the overall experience and excitement of the destination.
For our final example, you’ll recall from our October webinar, How to Maximize Your Association’s Use of Twitter, we provided examples of how AGC of America tested the same tweets with and without images for their magazine’s Twitter account, @ConstructorMag. Aside from the images, the tweets read exactly the same and were tweeted at the same time, one day apart. Here’s how each tweet performed:
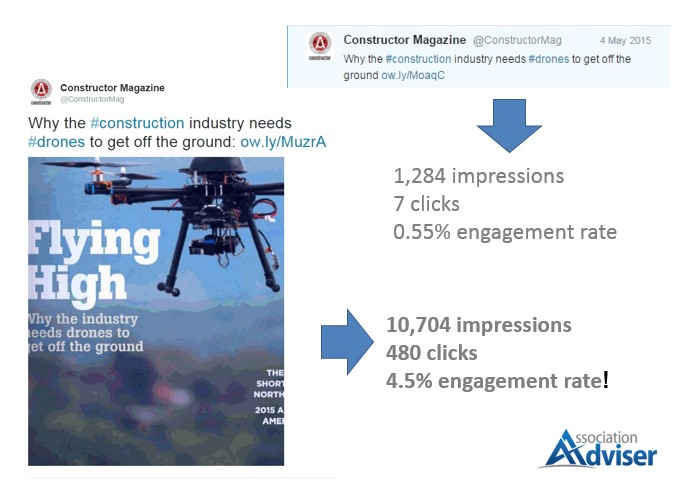
The tweet that included a relevant image had 3.7 times more impressions, 28 times more clicks and a higher engagement rate compared to the same tweet without an image. Engagement rate is the number of tweet engagements divided by impressions. According to Social Bakers, the average post engagement rate is about .07 percent for a tweet.
We also tested this across multiple tweets. Here are the top five tweets by engagement rate from that same issue’s Twitter campaign:
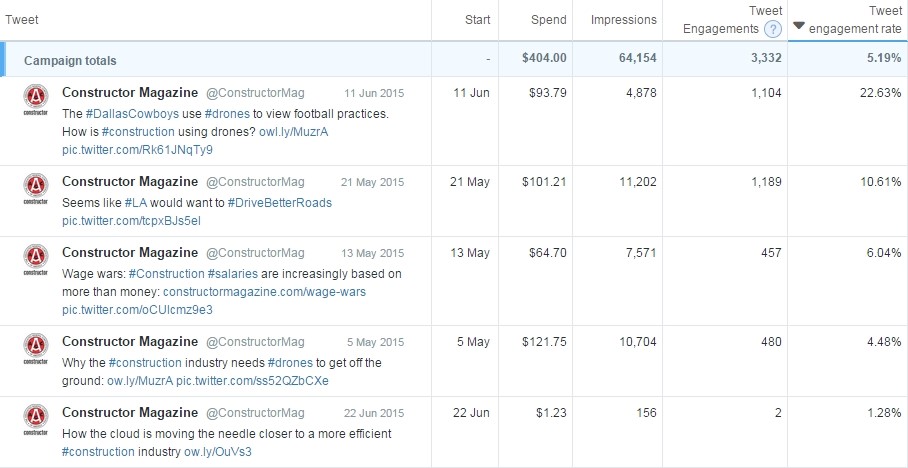
You’ll notice that four of five of these tweets include photos. The last tweet on this list did not include a photo. The number of impressions, tweet engagements and the engagement rate are all significantly higher for the first four tweets compared to the last tweet, which had fewer than 200 impressions and two tweet engagements. It’s pretty clear that people love to look at visuals and are more likely to interact with posts that are illustrated with a relevant graphic or photo.
Like the United Motorcoach Association, AGC of America also tested which type of graphics get a better response from their followers.
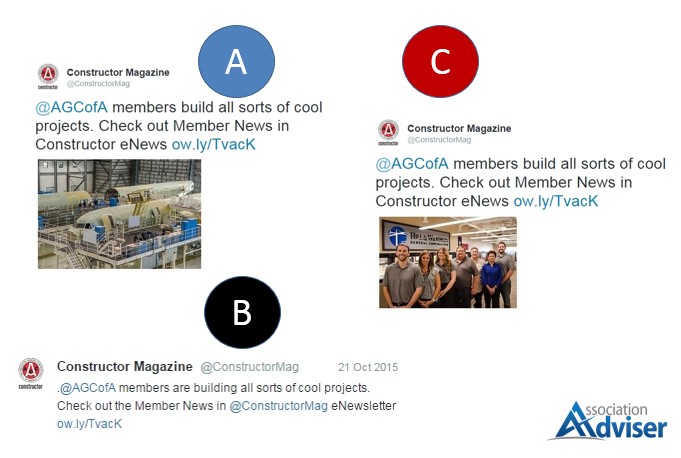
In this example, we took information about member projects that link to a specific article in AGC’s monthly magazine and tweeted the same text three times. However, one included a warehouse image (A), the other had no image at all (B), and the final image included employees of a member company (C).
Which of these three do you think performed the best? Let’s take a look at the results:
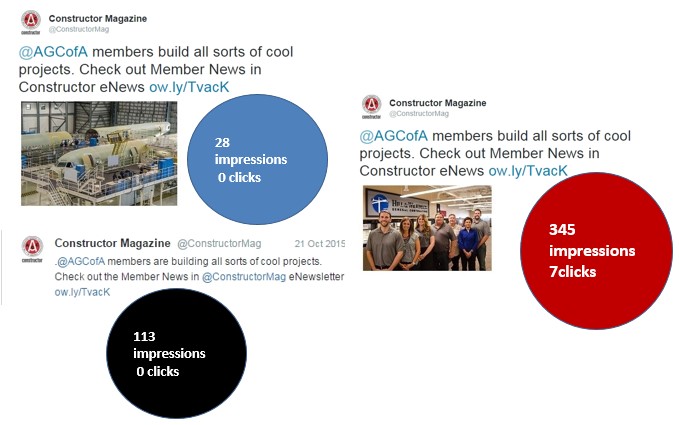
If you thought the tweets with images performed best, you were right. However, the results were mixed. The tweet that included a photo of people performed the best, just as we saw with UMA’s example. What’s surprising is that the warehouse photo didn’t perform well compared to the other two tweets. The tweet without a photo performed better than the warehouse image, but not as well as the photo that included people. What this shows us is that it’s okay to send out a tweet without a photo. Photos don’t always work, and this experiment let us know which types of photos resonate with our followers and which do not. Go with images of real-life people whenever you can.
Not only is it important to include graphics where possible in your association’s emails, social media posts, and blogs, but you should also be conducting A/B tests to see what types of images work better for your target audience. You may find that infographics perform better in terms of clicks, retweets, or likes over a generic stock photo.
Conclusion
As you can see from the examples we provided above, the use of images in your association’s communications can significantly impact how members and potential members interact with and view your association. When selecting images to coincide with the content you produce, select visuals that your audience can relate to, whether its potential attendees to an event you’re hosting or giving prospective new members a taste of your association’s environment.
Don’t forget, you can create a lasting impression on your members by featuring images of your association’s staff, events, publications, and more. Show them what your association is truly about and what they can expect as a member.
How has your association effectively incorporated visual content? Share your story with us in the comments below.
Brianna Lawson is an online marketing specialist at Naylor Association Solutions.
